Porting Calculator Instructions
The new version 15a totally shifts away from going by the time*area of the ports to utilizing the calculated delivery ratio thru the RPM range. Watch this video and the one that follows it that I made explaining the program and how to use it.: Youtube
Sheet 1 is pretty straight forward if you also read the hidden comments. Just fill in the cells that are colored light blue before going to sheet 2. "CCR" is "crankcase compression ratio" and is very important to measure which is described in the hidden comment of cell A8.

This program allows you to use it as a relative reference for porting changes, noting the changes in power thru the pipe powerband (the top 25% RPM). You can virtually lower the cylinder for better low RPM power by increasing the "above ports distances in millimeters", or raising the ports for better high RPM power by reducing the mm above ports.
The light blue data cells are where you enter information. Keep in mind that the pipe sets the engines powerband (RPM range where the engine is "on the pipe"), especially the end RPM. You can tell by feeling while riding along with a tachometer what the RPM range is of the pipes powerband. This program exists to allow you to see the power change after entering different values (such as a longer exhaust port duration with less mm above exhaust port). That helps you decide on any needed porting changes.
3 Types of Exhaust Ports
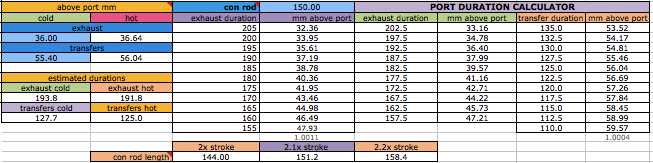
The program needs you to enter the "above port" mm distances for the exhaust and transfers and boost port. These are from top of ports to the point on the cylinder equal to the top edge of the piston at TDC (or to top of cylinder and then subtract the deck). If the transfers have staggered heights then you can use an estimated average by using the mini calculator at H151.

When entering RPM or any other number do not type in the comma. For example enter 9000 instead of 9,000. The port "duration" refers to how many crank degress the port is open each crank revolution. This program calculates port durations, both cold and hot, according to the above port mm you enter. Click here for an online port duration and piston height calculator. But when the conrod gets hot it extends more than the cylinder does and so the port durations lessen. The engine quickly warms up and so what it mostly experiences are the hot durations which is what this program goes by.
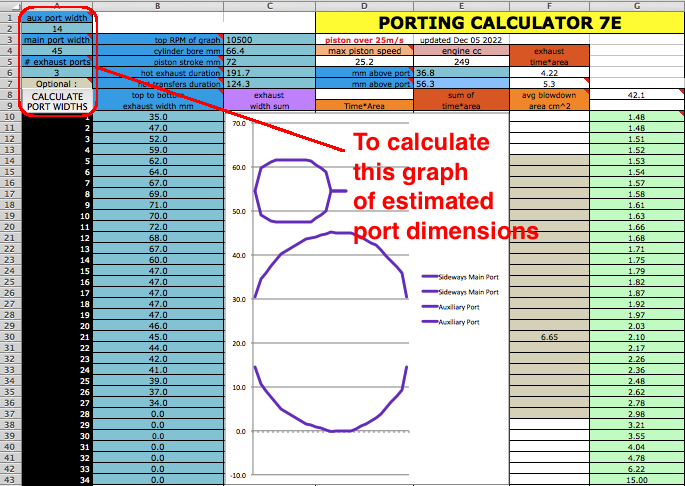
You can let the program give a rough estimate of the port widths every 1mm down or you can measure and enter them manually (for more precision). To calculate the estimated widths just enter the required values at A2, A4, and A6 and then click the Calculate button (macro). The visual display of the exhaust port is as if the cylinder were laying on its side.
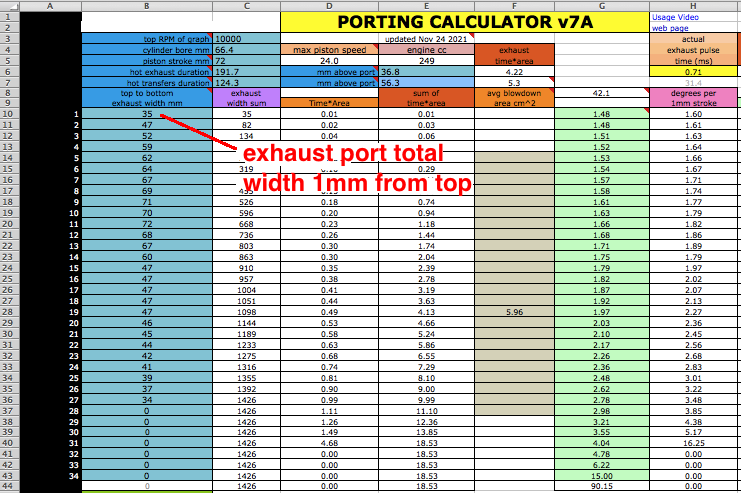
Manual Entry: Measure the exhaust port total width every 1mm down by first creating a paper trace of the exhaust port(s).
You can download a paper that has horizontal lines every 1mm down if you don't want to draw the lines on your paper trace.
How to get the port trace:
With cylinder removed...
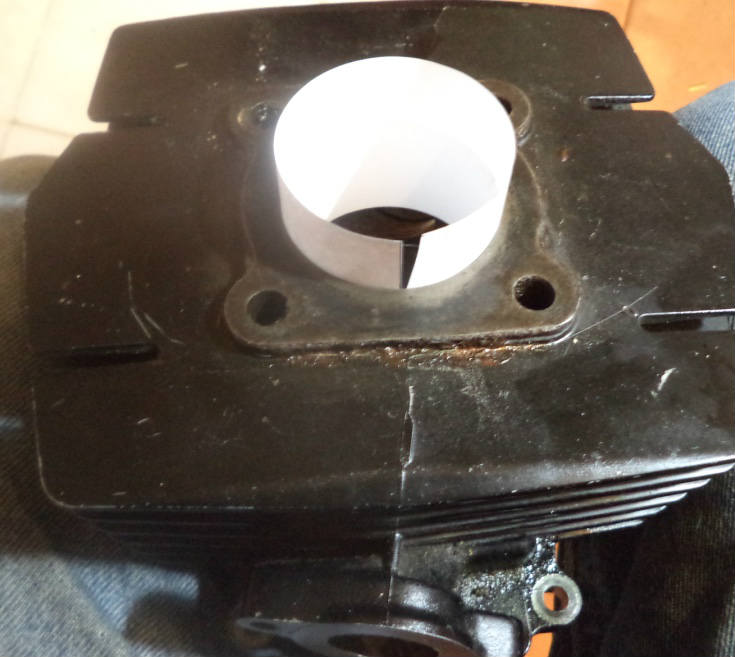
Just cut a rectangle of paper as tall as from the cylinder top to a bit beyond the bottom of the port. Its width should be a bit more than the cylinder diameter multiplied by 3. Insert the paper into the cylinder so that its top edge is even with the top edge of the cylinder.
With cylinder on bike but head removed...
Just cut a rectangle of paper as tall as from the cylinder top to the piston edge with the piston as low as it will go. Its width should be a bit more than the cylinder diameter multiplied by 3. Insert the paper into the cylinder so that its bottom edge is even with the top edge of the piston.
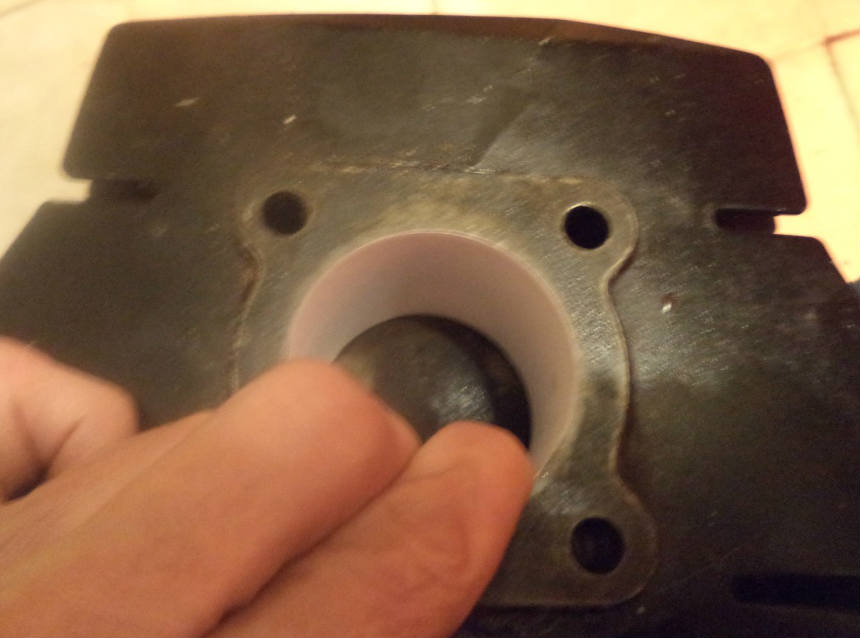
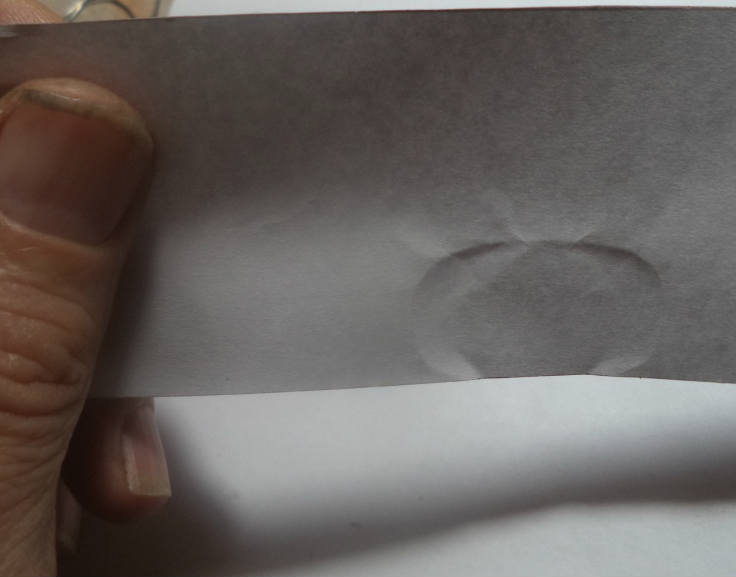
Then spread the paper apart so it is pressing against all of the cylinder and then hold it in place where the paper overlaps itself. Then reach in and press your thumb onto the paper where you think the top of the port is. Once you can feel the top edge then press hard on the edge without pushing the paper into the exhaust port. Do this all along the exhaust ports edges.
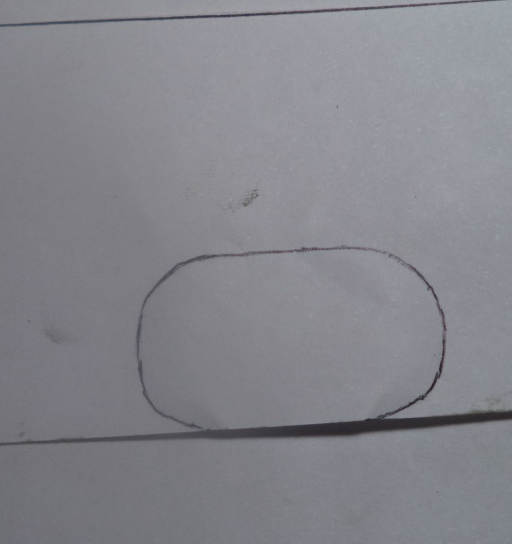
Remove the paper and enhance the trace with an ink pen.
Mark along both sides of the ports every 1mm and use ruler and pen to connect the marks.
Then use your ruler to measure each port width for each 1mm and write them down as illustrated below. It's not necessary to go all the way to the bottom of the port.

Sum each row of the three columns and enter each total in PortCalc with top port width at B10 and then sequencing down. Make sure only zeroes are under the last width you enter.
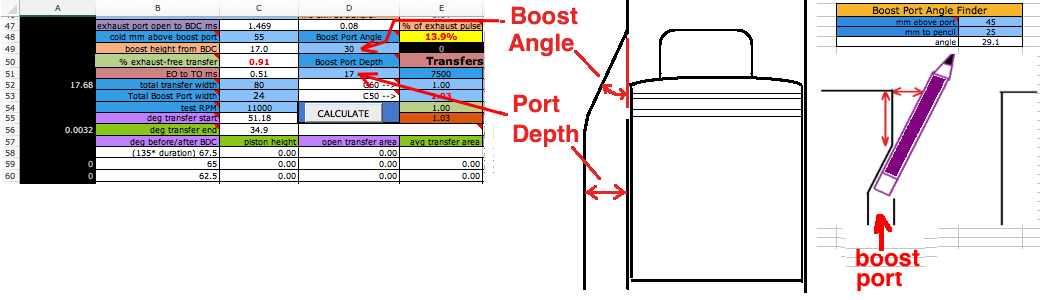
Enter the mm above the boost port(s) at C48, and the total width of all boost ports at C53. Enter the boost port depth at D51 and the angle at D49 (which is close to 30 degrees typically). At the bottom left of the calculator is a Boost Port Angle Finder to help you know the port angle.
The red graph (above the main graph) will be 1.0 as long as the combustion pressure exists in the cylinder. This fraction for each RPM comes from C50. It's common for engines to have less than 1.o at high RPM. If there's not enough blowdown to keep from limiting top RPM power then the exhaust port needs to be raised, or the transfers need to be lowered, or the top RPM needs to be lowered. This # is a fraction of the transfer time (from opening till BDC) so that .80 means the combustion pressure dissipates when the piston edge lowers to 80% of the remaining port time till BDC.
The Horsepower & Delivery Ratio graph shows the HP as the red graph, and the DR as the blue graph. Ideally the DR should peak at the beginning RPM of the pipe powerband. If it peaks to the right of that then the CCR (crankcase compression ratio) is too much, and to the left indicates too little CCR.
Before clicking to generate the graphs, if you also have my pipe calculator program and have entered the data into it, then enter its name here and put an X at D122. That will retrieve the pipe boost data to give you the most accurate graph. Both spreadsheets need to be in the same folder. If you don't have the pipe calcilator then one of the other 4 options for column D.

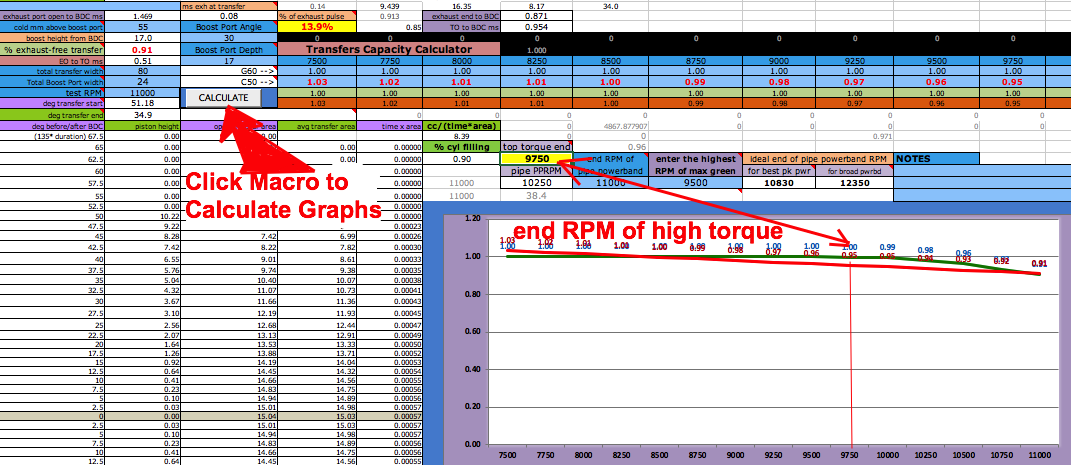
Click the Calculate button at D54 to generate the graphs. If you can't use macros then just enter the displayed RPM at E51 into C54 then enter the value from G60 into E52, and the value from C50 into E53. Repeat for the next RPM (250 higher): Enter the displayed RPM at F51 into C54 then enter the value from G60 into F52, and the value from C50 into F53. Do this for every increment of 250 RPM (till T51) and then read the graphs.
Then scroll down to look at the other graphs. The "Transferred cc" graph shows how many crank degrees it takes for all the transfer flow to happen. In this example the flow ends shortly after BDC. The next "Transfer Flow" graph shows how much of the transfer flow exits the exhaust port. The amount of the blue graph that extends to the right of the red spike is the amount lost out the exhaust port. The two lower graphs show the delivery ratio thru the RPM range, and the same graph you already saw above. The "Pipe Boost" graph is very important. The pipe boost affects the final horsepower graph a lot. In the D column (row 117-121) you can choose what type of pipe is attached to the engine. This allows a very crude guess of what the boost will be. It's best to get the pipe boost #s from my exhaust pipe calculator at row 300 of sheet 3 and enter them here at row 121. The 4 types of pipe you can select other than "custom pipe" assume the end of the pipe powerband happens at the end RPM you entered at C3. You can shift the pipe boost left or right by changing the pipe header length in the pipe program. The delivery ratio graph peak can be moved left or right by changing the CCR (at B8 sheet 1 which normally varies between 1.3 and 1.6).

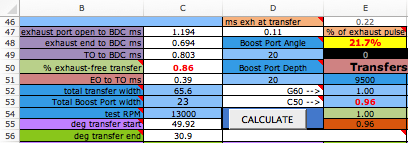
Take note at E48 what % of the exhaust pulse overlaps the transfer opening (for the RPM at C54) with the engines real top RPM entered at C3. If that is more than 22% at top RPM then you need to raise and/or widen the exhaust port. If it is less than 0% then the exhaust port is too high. More than a 22% overlap causes a message to appear at D56 telling you to raise/widen the exhaust port.
When you hover the pointer over cells with a top right red corner then its comments will display. The bottom section of this page shows all comments.
You can try different CCR to see the effects graphed. To lower the CCR on the engine you'll have to put a spacer between the engine and the reed valve. To raise it you will need to either stuff the unused space in the reed valve area or stuff the crank.
Unlike my predecessors I am not listing any port duration charts because they are all just too generic to be of any real use. If you want to do something right then don't take such shortcuts. Each engine needs to be analyzed with calculators such as this one. And be aware that the formulas and method used here are unique to this program.
Here's a customer report:
"Yesterday I completed around 145 km riding my bike with the ported cylinders using your program. It was such wonderful power delivery starting from 3000 RPM and above, especially in hilly areas.
I'm really happy and proud using your program for cylinder porting, such perfect calculations giving a wonderful output."
YOUTUBE VIDEO
Here's the hidden comments in each cell in case the program fails to show each one completely:
Sheet Cell Comment
Porting 1 $C$5 "Engine size calculated from the pistons swept volume from BDC to TDC."
Porting 1 $A$6 Piston stroke in mm
Porting 1 $C$6 Above port engine size (trapped volume) calculated on 2nd sheet, dependent on port height and compression ratio.
Porting 1 $A$8 Crankcase compression ratio. Most race engines that rev up to 11K have 1.4 to 1.5 as the ratio. The higher the RPM, the higher the ratio should be but sometimes the extra heat generated above 11K is too much for the engine when the delivery ratio is optimal. The Arilia RSA125 used 1.33 to keep the heat down although 1.5 was best on paper for power.
To measure it: Take off the cylinder and position the piston in it at its TDC position. Place it upside down on the floor and fill it with cooking oil while measuring how much you add. Fill till the oil is even with the base of the cylinder and transfers. This is volume 1. Now put something under the front wheel to raise it so that the top of the transfers on the crankcase are very horizontal. Position the crank close to the TDC position. Fill it up till the top of the transfers while measuring how much is poured in. This is volume 2. If you didn't measure in milliliters then convert the volumes to ml. 1 ml is equal to 1 cc. Add the two volumes of cc together and divide that by that sum after the engine size is subtracted from it. That will be the CCR. The transfers don't use that ratio but they use a reduced ratio for when the transfers are opened by the descending piston. This calculator figures out the true ratio the transfers use. The measured ratio is what is required in this cell."
Porting 1 $C$8 This is the actual ratio that the engine experiences by the height of the transfers.
Porting 1 $A$10 The trapped compression ratio has to do with the head/cylinder volume above the exhaust port. It's that volume divided by the volume in head/cylinder above the piston when the piston is at the TDC position. There is a calculator for that near the bottom of the 2nd sheet here.
Porting 1 $A$14 This is only here to reinforce the idea that all "above port" measurements aren't to the top of the cylinder. Its till the top of the cylinder minus the deck which is what I call the TDC point.
Porting 1 $A$16 "From top of port to where the top edge of the piston is at the cylinder at TDC. (Or from top of port to top of cylinder and then subtract the deck.)
"
Porting 1 $C$19 Blowdown degrees. Too little allows too much combustion pressure overlap of the transfers. Look at the % of opening of transfers at C50 on sheet 2 which is unhindeered by combustion pressure.
Porting 1 $A$22 If this changes from top to bottom of port then use the distance halfway down the port. This is one port width. It will be multiplied by 2.
Porting 1 $A$28 See drawing. One port width. It will be multiplied by 2.
Porting 1 $A$34 If you are creating a boost port then make its total width equal to 30% of the total width of all the transfer ports added together.
Porting 1 $C$34 The accepted standard is no more than 30% of the combined transfers width for the boost port width.
Porting 1 $A$38 Total transfer port width, the A port width times 2, and the B port width times 2.
Porting 1 $C$38 Typical race engine has 1.6x bore for transfers and boost port combined widths.
Porting 1 $A$39 Total transfer port width, the A port width times 2, and the B port width times 2.
Sheet Cell Comment
Porting 2 $A$1 "Average mm port width of one aux port of a 3 port exhaust. Don't bother with this unless you are going to click the Calculate button at A8."
Porting 2 $B$1 "If unknown then just multiply the stroke by 2 and enter that."
Porting 2 $L$1 This is the fraction the intake cc is of the trapped cc.
Porting 2 $N$1 The center height of the piston dome. If you don't know then just multiply .06 times the bore and use that result. But if you know it's flat topped then enter 0.
Porting 2 $B$2 1.2 to 2 is the range allowed. 1.5 is common on most engines.
Porting 2 $A$3 mm port width on paper trace (1.12x that of straight across). For a bridged port measure the max width and subtract the width of the bridge. Don't bother with this unless you are going to click the Calculate button at A8.
Porting 2 $B$3 This should be the end RPM of pipe boost for the graph with the pipe boost added to the horsepower to be correct.
Porting 2 $K$3 engine volume cc above exhaust port
Porting 2 $M$3 Measure the head volume to enter here. If you don't want to measure it then use the estimated volume at M5 which depends on the compr ratio at A13. If you don't know it then look it up on the internet or use the mini calculator at the bottom left of this sheet to figure out the compression ratio to put at A13. Then if you reduce the mm above exhaust port at E6 you should change the compression ratio because raising the port reduces the compression ratio. The hp formulas make use of the trapped cc which is why the compression ratio has to be changed along with a change of "above port" mm of exhaust port. But it isn't very picky about it's accuracy but it's good to have it close to reality.
Porting 2 $N$3 The vertical mm from top of gasket to where the piston edge is at TDC. If you don't know it or want to measure it then just enter 1.5
Porting 2 $D$4 This is in meters/sec which should stay below 25 for piston longevity
Porting 2 $A$5 Enter 1 for single port, 2 for bridged port, or 3 for a center port with two side auxiliary ports. Don't bother with this unless you are going to click the Calculate button at A8.
Porting 2 $B$5 allowable range is between 28mm and 81mm.
Porting 2 $M$5 Estimated head volume
Porting 2 $B$6 Degrees of hot open port duration from the calculated hot duration from H105 which goes by the calculated hot mm above port, stroke, and conrod length. The cold duration is at G105.
Porting 2 $D$6 Measured mm from top of exhaust port to where the top piston edge is at TDC. This is the cold measurement and the program will estimate the hot duration for that so don't use my method for finding the hot distance above port.
Porting 2 $G$6 exhaust time*area
Porting 2 $K$6 Squish volume including it extended over piston
Porting 2 $M$6 milleseconds per crank rotation degree
Porting 2 $A$7 Enter the data at A2, A4, and A6 and then click on this button if you don't want to measure each width every 1mm down. It just gives an estimate but its fairly close. Otherwise you can ignore those and the button and measure your port widths and enter them manually into the cells from B10 to B43. Without macros you can enter the calculated port widths that display at AU10 to AU43.
Porting 2 $B$7 Degrees of hot open port duration from the calculated hot duration from H107 which goes by the calculated hot mm above port, stroke, and conrod length. The cold duration is at G107.
Porting 2 $D$7 Measured mm from top of transfers to the cylinder where the piston edge is at TDC. This is the cold measurement and the program will estimate the hot duration for that. If front and rear transfers have different distances then find their average by using the mini calculator below that gives the average distance at K59. The distance above the boost port should be entered at C48.
Porting 2 $G$7 Equivalent mm height of head if it was flat topped, not a dome.
Porting 2 $B$8 Total port width every 1mm down. Click on "web page" at H2 for complete details.
Porting 2 $D$8 If this says "Lower Transfers" then they are so high they are exceeding the programs limits. 137.5 is the biggest transfer duration allowed.
Porting 2 $F$8 average area over the whole blowdown time
Porting 2 $G$8 Height of equivalent cylinder above port
Porting 2 $G$10 Reference data for 78mm stroke. Degrees per 1mm piston travel.
Porting 2 $A$12 Engine compression ratio of trapped volume. If you haven't measured it then try to find the engine specs on-line. Notice how this ratio will lower as you raise the exhaust port. If you want to restore the original ratio then lathe down the cylinder top or the head surface as much as is needed to restore the ratio. If you don't want to lathe it down then lower this ratio until the cc at L4 is equal to the value you saved at M4 before you raised the exhaust port. You can use the mini calculator at the bottom left of this sheet to know what the trapped compression ratio is.
Porting 2 $A$14 Elevation above sea level in feet.
Porting 2 $A$16 Expected PSI when the rings and cylinder are good.
Porting 2 $D$46 Milliseconds the open transfers are exposed to exhaust heat/pressure due in inadequate blowdown.
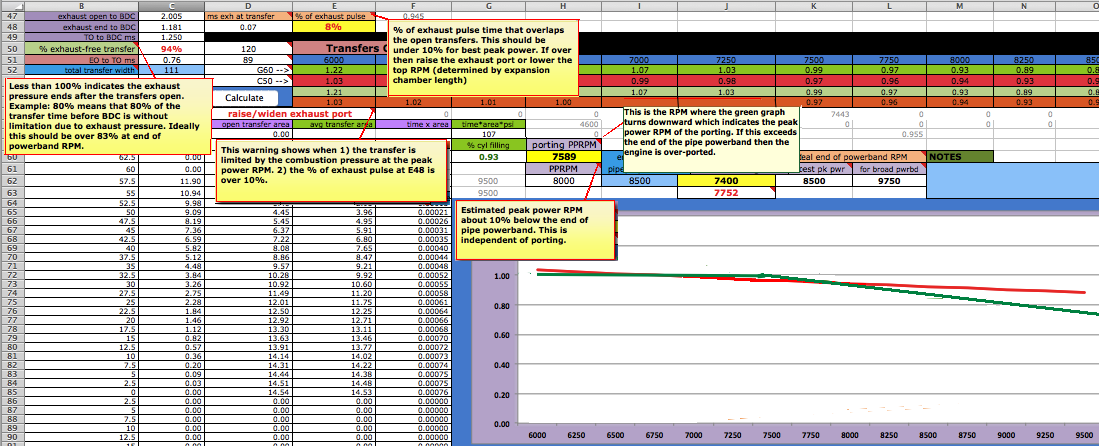
Porting 2 $E$47 % of exhaust pulse time that overlaps the open transfers. Usually the engine won't rev out past the RPM that produces 22% (or more) here or past the RPM that produces less than 0.8 at C50. More than 22% causes too much exhaust gases to expand into the transfer and boost channels. When this is very bad then those channels become blackened. Most ideal is 12% to 16% for racers and 16% to 22% for street/trail. You'd think 0% would be best but not so, which is because the exhaust port would have to be much higher which lowers the actual engine size (trapped volume).
Porting 2 $B$48 From port top to TDC mark on the cylinder (to cylinder top minus deck).
Porting 2 $D$48 This is the degree angle of the inner top surface of the boost port. See mini calculator and drawing at A117.
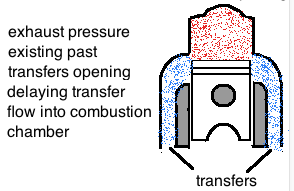
Porting 2 $B$50 Less than 100% indicates the exhaust pressure ends after the transfers open which delays the transfer flow. Example: 90% (0.90) means that only 90% of the transfer time before BDC is without limitation due to exhaust pressure. 0.95 or more should be at peak power RPM of porting. Enter that value at C54 to see what results at C50.
Porting 2 $D$50 This is the lateral distance from piston to back side of boost port for the vertically straight portion of the boost channel.
Porting 2 $B$52 Width of all transfers added together in millimeters. Boost port not included. Typical race engine has 1.6 x bore. This width is on the paper that was pressure traced inside the cylinder which is more than just measuring the widths straight across from edge to edge.
Porting 2 $D$52 Delivery ratio at G60. Without the use of macros you can enter each one after you select a different RPM at C54 (matching the #s at row 51). This row displays as the green graph.
Porting 2 $B$53 This is all the boost port widths added together. Typical is .3 x transfer width total. If the boosts are wider than this then they can keep the transfer flow from hugging the back of the cylinder.
Porting 2 $D$53 Without the use of the macro below you can enter each one manually after changing the RPM at C54 each time. This row displays as the red graph which shows the % of transfer time that is without exhaust pulse overlap.
Porting 2 $B$54 If your computer don't use Macros then enter each test RPM here till the # at G60 is 1 which reveals the peak power RPM.
Porting 2 $B$55 degrees before BDC that the transfers begin to open as the descending piston uncovers them.
Porting 2 $B$56 degrees after BDC that transfer flow ends, or the transfer port closes, whichever comes first.
Porting 2 $D$56 "This warning shows when at top RPM
1) the % of exhaust-free transfer time is under 80%
2) the % of exhaust pulse at E48 is over 22%."
Porting 2 $K$57 average power for 1st half of graph
Porting 2 $H$58 Less than 100% means the cross sectional transfer flow into the cylinder is less than the rear half of the cylinder. Less means the transfers have less area than what is ideal. The less it is, the lower the delivery ratio and the more likely intake charge will partially exit the exhaust port due to excessive flow speed due to smaller transfers.
Porting 2 $G$59 This reveals the % of the area above the exhaust port that is filled with intake charge when the rising piston closes the port. This is mostly determined by the flow area of the transfers & boost port.
Porting 2 $P$65 This is important to know the new compression ratio if you raise the exhaust port w/o lowering the head. Doing so lowers the copression ratio which lowers the power a little. So if you want to see a new power graph with a raised exhaust port then do this calculation first so you can also enter the new compression ratio which you'll need to enter at A13.
Porting 2 $P$66 Trapped compression ratio (above exhaust port)
Porting 2 $P$67 The millimeters from exhaust port top to the deck point of the cylinder. This is the set point for any virutal changes that you want compared to this.
Porting 2 $P$68 The cc the piston sweeps thru from exhaust port top to TDC (not including head volume)
Porting 2 $P$69 The total cc above the piston at its TDC position.
Porting 2 $Y$69 this factor multiplies the horseower. It increases with an increase in engine compression.
Porting 2 $P$70 This is the total cc above the exhaust port, including head volume. This is the true engine size.
Porting 2 $P$75 When you use the new "mm above exhaust port" then you also have to enter this value at A13.
Porting 2 $P$77 Keep notes here on the old data. Enter the height above the exhaust port and the transfer ports.
Porting 2 $P$78 Note the RPM where the two lines intersect which is at N65.
Porting 2 $P$79 The fraction of the time from transfers open to BDC that is free from combustion pressure. If this is less than .8 (80%) then you need to raise the exhaust port for more blowdown.
Porting 2 $P$81 Keep notes here on the new data.
Porting 2 $R$81 The % change from the old to the new.
Porting 2 $P$83 The fraction of the time from transfers open to BDC that is free from combustion pressure. If this is less than .8 (80%) then you need to raise the exhaust port for more blowdown.
Porting 2 $P$85 Keep notes here on the new data.
Porting 2 $P$87 The fraction of the time from transfers open to BDC that is free from combustion pressure. If this is less than .8 (80%) then you need to raise the exhaust port for more blowdown.
Porting 2 $P$89 Keep notes here on the new data.
Porting 2 $P$91 The fraction of the time from transfers open to BDC that is free from combustion pressure. If this is less than .8 (80%) then you need to raise the exhaust port for more blowdown.
Porting 2 $G$93 Change this # till the red graph is showing near the real HP # your engine really has.
Porting 2 $K$93 When this is 0 then the Accel HP graph doesn't show. The # entered determines its height. It shows how the horsepower needs to increase non-linearly as RPM increases.
Porting 2 $I$95 conecting rod length eye to eye
Porting 2 $G$96 This is to the TDC point which is equal to the distance to cylinder top and then subtracting the deck distance.
Porting 2 $D$105 mm from piston top @ TDC
Porting 2 $H$110 This is the hot transfer duration that the program uses. It's derived from the average "above port" distance figured at I162.
Porting 2 $H$113 This is normally 2x to 2.1x the stroke.
Porting 2 $C$116 You can put an X beside the type exhaust pipe you have, or if you have my pipe calculator then get the boost #s from row 300 on sheet 3 to put here in row 121 starting at column E. Make sure the end RPM of the pipe calculator and this program are the same. Make sure only one of these cells are check marked.
Porting 2 $C$117 Moped pipe w/o expanding or contracting cones. This gives a very linear powerband but is somewhat weak.
Porting 2 $A$118 From top of port to top of cylinder
Porting 2 $C$118 Pipe with expanding cone (diffuser) but no contracting cone (baffle). Some mopeds have this. Also my Suzuki AX100 did.
Porting 2 $C$119 Street/trail expansion chambers usually have longer baffle cones, like around 300mm long, and "straight" headers (non-flared). Racing pipes have short baffles close to 180mm, and short bellies like around 90mm.
Porting 2 $C$120 Racing pipes typically have flared headers for more over-rev, short baffles (like 190mm), and single cone diffusers.
Porting 2 $C$121 This can be from row 300 on sheet 3 of my pipe calculator after you've entered in all your data
Porting 2 $A$127 formula factorwas reduced from .71 to .6
Porting 2 $A$129 cross sectional area of the unfilled middle of the cylinder
Porting 2 $M$141 This is the horsepower # for the third from the left RPM.
Porting 2 $M$142 This is the horsepower # from the graph for the 6th from the right RPM.
Porting 2 $M$143 This is the horsepower # from the graph for the 2nd from the right RPM.
Porting 2 $M$146 Keep notes here on the old data. Enter the height above the exhaust port and the transfer ports.
Porting 2 $M$147 Note the horsepower here from what is listed at N141.
Porting 2 $M$148 Note the horspwer here from what is listed at N142.
Porting 2 $M$149 Note the horsepower here listed at N143.
Porting 2 $M$151 Keep notes here on the new data (heights over ports and the resultant power).
Porting 2 $P$151 This shows the % increase in power at middle RPM.
Porting 2 $P$156 This shows the % increase in power at middle RPM.
Porting 2 $P$161 This shows the % increase in power at middle RPM.
Porting 2 $L$197 You can find this volume by taking the cylinder off the engine and positioning the piston in it at its TDC position and then adding cooking oil to the upside down cylinder. Measure the amount of oil added. Subtract a few cc from that due to the fact that the conrod isn't there. That is the upper volume. Then raise the bikes front end till the crankcase/cylinder mating surface is level, not leaning forward. With the crank positioned @ TDC pour in cooking oil till it fills the crankcase up to the mating surface. It's best to measure amounts added little by little than to pour it out and measure it. This is the lower volume. The two volumes added together are the total crankcase volume at TDC. Milliliters = cc.
Porting 2 $C$199 millimeters from top of exhaust port to cylinder top.
Porting 2 $D$199 At TDC the distance between cylinder top and piston edge. If it is above the cylinder top then enter it as a negative #.
Porting 2 $G$199 The above port total engine volume. This is the true 2 stroke engine size.
Porting 2 $H$199 the volume the piston dome occupies.
Porting 2 $I$199 the combustion chamber volume at TDC.
Porting 2 $E$200 Cylinder diameter in millimeters.
Porting 2 $F$200 With the spark plug in, invert the head and pour a liquid (ie: alcohol) to fill it and then pour it out and measure it.
Porting 2 $F$206 center dome height over the piston edge
Porting 2 $G$206 Some flat top pistons have a bevel on the outer edge that raises the whole flat area above the corner edge of the piston like 0.5-1.0mm. If yours has no bevel then just enter 0.
Porting 2 $K$206 In the drawing below the transfers roof is 22 degrees and the boost ports roof is 33 degrees. These measurements don't need to be precise.
Porting 2 $K$207 In the drawing transfer A is 68 degrees rearward, and transfer B is 91 degrees (so its just a tiny bit forward directing).
Porting 2 $L$208 Strength of the transfer flow in the rearward direction (towards intake side).
Porting 2 $L$210 This should be around 2. More than means you can widen the boost ports, and less than that means maybe the boost ports are too wide and you should narrow them with JBWeld.
HOME