| First I was a "warmist". I believed it's a scientific fact that carbon dioxide (CO2) increases surface temperatures and because of continued increase of CO2 release into the atmosphere we would soon be beyond the point of no return which would end in climate chaos and rising oceans. Then I decided to make sure I wasn't being misled and to listen to opposite views and so tuned in to the "coolists" that took the opposite view that the Earth has been cooling instead. I thought they had some very good arguments and was left not sure who to believe. Both sides had good scientific data and theories. Then I found out that the temperature stations had been changing and that the scientists were making manipulations of the data for various reasons. So I considered them unreliable and decided to look up the local temperature record down here in Paraguay to see if it reflected a warming or a cooling of the global temperature. What it showed was the same rate of warming increase that the lower troposphere charts show. (I still don't trust the surface temperature records). Also at the same time (beginning of 2016) I found local newspaper articles showing that local temperatures had been the highest in 2014 and 2015, just the same as the warmists have been saying. But Paraguay data and other sources are showing a big dip in temperature of 2016 but GISS is showing a bigger increase than ever. But that's OK because each region has it's own odd temperature fluctuations that varies from the average global temperature. (2017 shows a global cooling trend.) 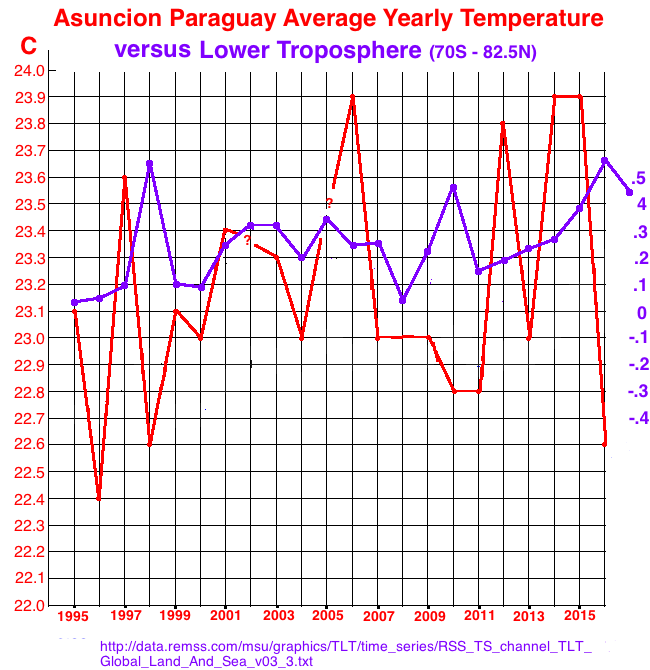 Below is the data from the GISS site showing the monthly temperature increases and the yearly averages in the last column. You half to divide the numbers by 100 to get the numbers in Celsius.  Here is the graphs of the GISS data showing how the El Nino temperature spike skewed the results and how the GISS yearly averages would be lower without it. From 2014 to 2016 they report a +.25C change, whereas without El Nino it would only be +.11C, less than half. The months of May to September were used since they weren't affected by El Nino. That big mountain in the middle from October 2015 to April 2016 was the temperature rise from El Nino.  I also decided to look to see if the satellite record of the lower troposphere temperatures reflect the same graph changes of the global surface temps. That is because in some cases a geographical region (such as Paraguay) will not reflect the global trend due to certain variables such as jet stream changes. So below are my own graphs from the raw data which does show they are close up to 2013 and then the surface record goes higher so I still think the best gauge is the lower troposphere temps. The graph extensions for 2017 are based on my own estimate from the January to March temps that are recorded. They show a downward trend now. 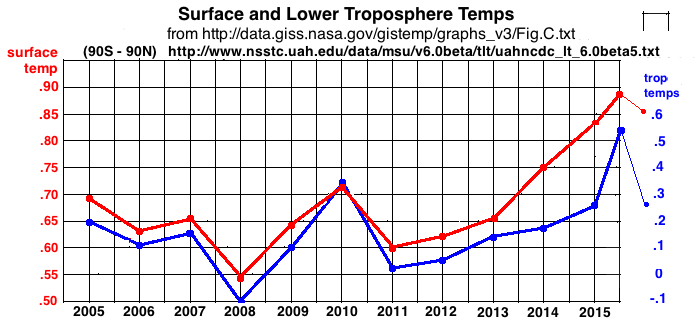 The graph below (source) shows lower troposphere temps from Jan 2014 to Dec of 2017. The upward spike in early 2016 was due to El Niño. Although it is mostly an event of the eastern part of the Pacific ocean it is agreed by scientists that it does affect global temperatures (reference). I found the dataset for the El Niño/Niña temp change here and it does correspond to global temp changes. It is usually followed by La Niña which has the opposite effect. 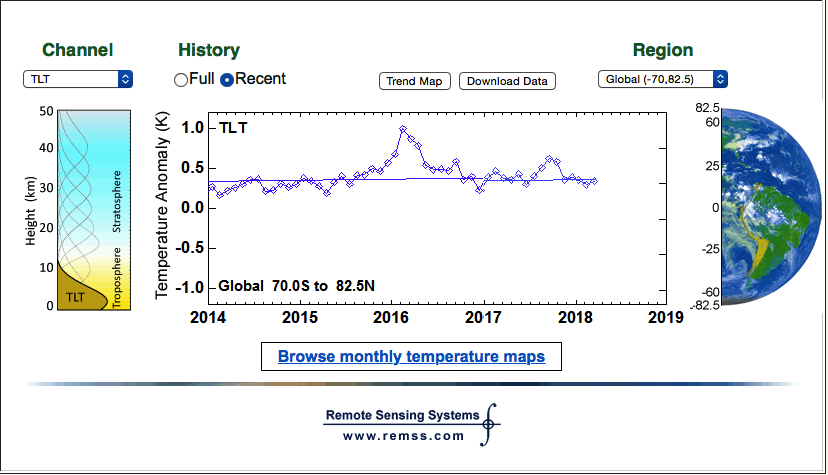 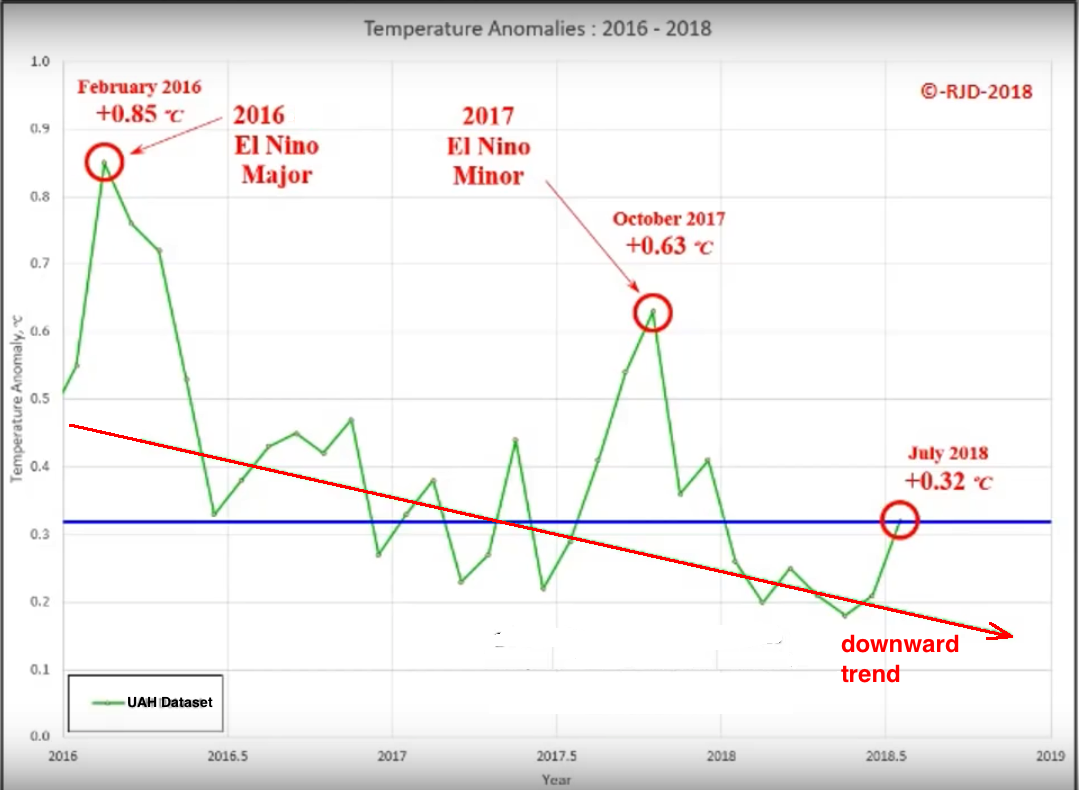 Now here is the same graph going all the way back to 1980 which shows an upward trend:  But here's the catch. Temps from 1930 to 1970 went down. All climate scientists around 1970 agreed on that. Not 97% consensus, but 100% concensus! Then from then to 2016 went up. So if temps go down and then go up can you say there is global warming since 1930? No, you can only say since 1970. If the temperature changes direction every 40 years can you claim global warming with the belief that it will only continue to rise? Not really. (Notice this true graph that shows 2016 just barely higher than 1921 and 1930. When graphs show 2016 much higher than 1930 that is because they have been wrongly tampered with to agree with their warmist beliefs.) 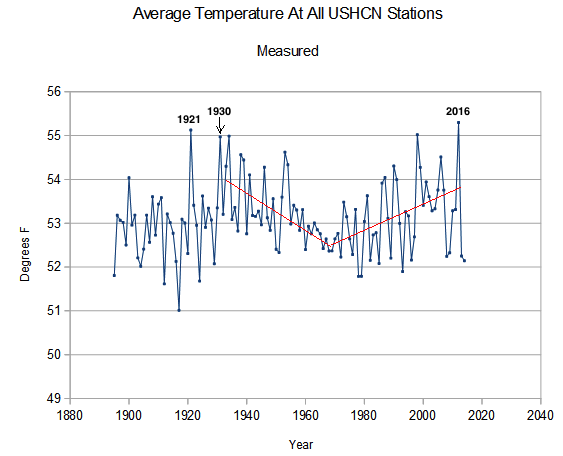 I disagree with the warmists forecasts of continued temperature rise beyond 2016 because of evidence showing that we are entering the 206 year solar cycle that will lessen solar radiation for a few decades (especially UV which has more warming effect than normal light from the sun). The bottom of that cycle will be in 2031 when the least amount of solar radiation will be received (similar to the Dalton Minimum of 1793 to 1830.) If that cycle is upon us then we are in for at least a slight downward trend in global temperatures. In July 2015 at the National Astronomy Meeting in Wales Valentina Zharkova, a mathematics professor from Northumbria University (UK), presented a model that can predict what solar cycles will look like far more accurately than was previously possible. She stated that the model can predict their influence with an accuracy of 97 percent, and says it is showing that Earth is heading for a prolonged period of little to no sunspots in approximately fifteen years. According to the Royal Astronomical Society (RAS): A new model of the Sun's solar cycle is producing unprecedentedly accurate predictions of irregularities within the Sun's 11-year heartbeat. Predictions from the model suggest that solar activity will fall by 60 per cent during the 2030s to conditions last seen during the "mini ice age" that began in 1645. (web site video) YouTube videos vary in their predictions ranging from only having harsher winters in Europe (due to the suns effect on the jet streams there), to it triggering the beginning of the next ice age. I believe the lowered sun activity is already causing global cooling due to the radical shift in yearly temperature here in Paraguay. In 2016 the winter was very cold (for here) and the summer wasn't anywhere near as unbearable as it normally is. (It's normally like Death Valley.) Cooling can be just as lethal as warming due to crop failures and the severity of winter storms. Also expected is an increase in earthquakes, volcanic eruptions, and floods (due to increased rainfall due to increased cloud cover due to increased cosmic solar rays during times of reduced sun spots). These increases are already becoming evident. 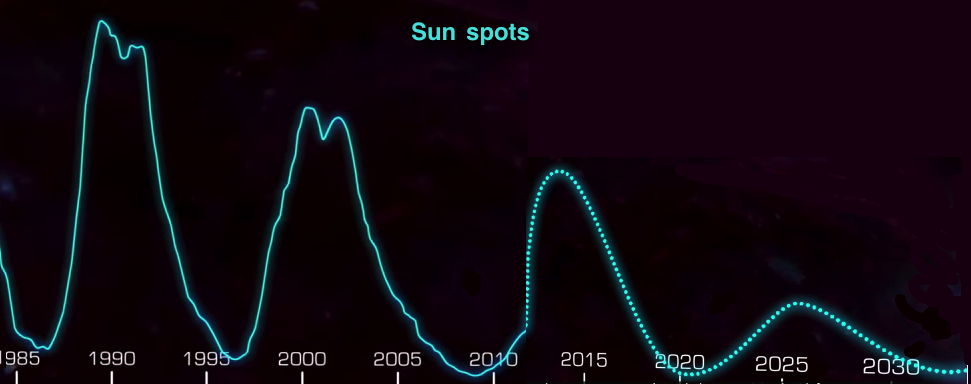 I recently came across this incredible video with good evidence that NASA and other organizations have been manipulating data to produce graphs showing global warming in excess of what has been happening. Why would they do that? Well, all these organizations get their money from the government and the governments of all the 1st world countries are promoting this agenda. The governments are invested in this plot to have more worldwide control with carbon taxes, etc. It's part of the trend toward one world government which the Illuminati and other groups and billionaires want. Have you seen pictures of the Georgia Guidestones? They outlines the Illuminati's goals for the near future. Well, starting in 2017 it's going to be obvious to the world that we are entering a cooling stage and their plan to unite all nations with the goal of reducing greenhouse gas emissions will fail. Click onto the graph to go to the video.  another great video revealing the scam So then what about "climate change"? OK let's look at extreme weather events to see if they are increasing. First let's look at the stats about hurricanes and tropical storms. Here is the definition for accumalted cyclone energy: Accumulated cyclone energy, or "ACE," is used to express the activity and destructive potential of individual tropical cyclones and entire tropical cyclone seasons. ACE is calculated as the square of the wind speed every 6 hours, and is then scaled by a factor of 10,000 for usability. The ACE of a season is the sum of the ACE for each storm and takes into account the number, strength, and duration of all the tropical storms in the season. The caveat to using ACE as a measure of the activity of a season is that it does not take the size of the hurricane or tropical storm into account. The damage potential of a hurricane is proportional to the square or cube of the maximum wind speed, and thus ACE is not only a measure of tropical cyclone activity, but a measure of the damage potential of an individual cyclone or a season.  OK that is good news that tropical storms are decreasing overall although if you look at the graph you will see a waviness to it. The latest low spot of that wave was in 2013 and the high spot in 2016/2017. 2017 Hurricanes: Yes there were many hurricanes but like I said 2017 was at the peak of the hurricane cycle. Some people have said that global warming was the cause because it increased the sea temperatures too much. Let's look at the record to see if that is true. 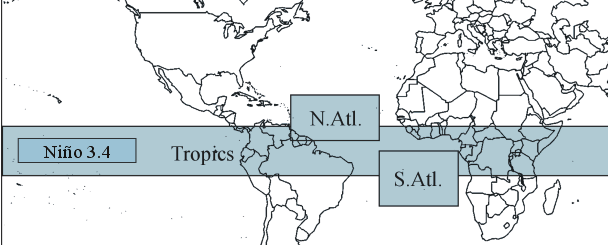 The graphic above shows the North Atlantic zone where these hurricanes originate. Below is a graph of the surface sea temperatures for that zone. The peak for 2017 is much lower than the peak for 2011 so we can't blame ocean temperatures. But these hurricanes result from the hot air from the Sahara desert blowing over a warm sea. Although the warm sea isn't to blame maybe the Sahara air current was worse in 2017. I don't deny that the last few years have been hot. So maybe the hurricanes were caused by the temporary global warming. But the warmists imply that hurricanes will get worse from here on out which is just not true. The North Atlantic temperatures are now descending and so we can predict that 2018 will have fewer or less intense hurricanes. 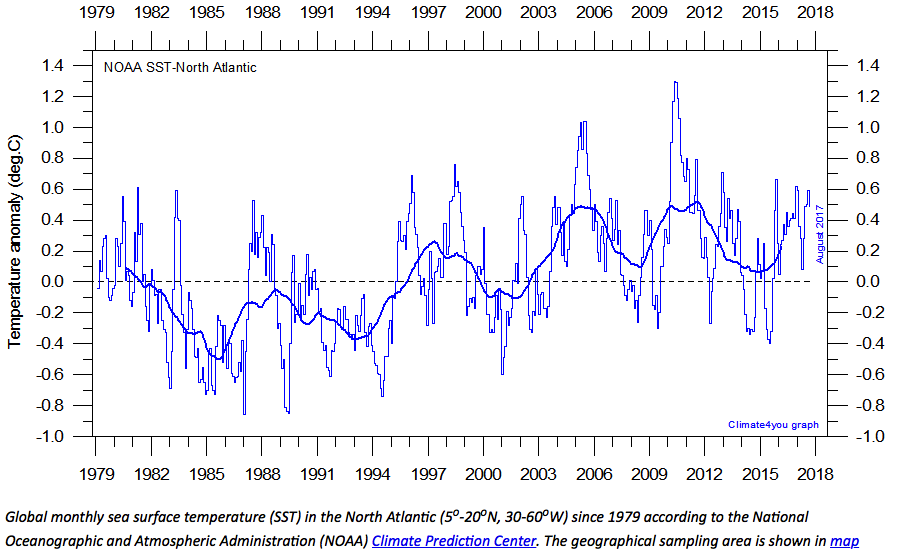 Wikipedia on Drought: Drought in the United States is similar to that of other portions of the globe. Below normal precipitation leads to drought, which is caused by an above average persistence of high pressure over the drought area. Droughts are periodic, alternating with floods over a series of years. The worst droughts in the history of the United States occurred during the 1930s and 1950s, periods of time known as 'Dust Bowl' years in which droughts lead to significant economic damages and social changes. The U.S. Drought Monitor provides national database to track the duration and severity of droughts in the United States, hosted by the University of Nebraska-Lincoln with assistance from the United States Department of Agriculture and the National Oceanic and Atmospheric Administration. Their standardized measurements track droughts on a severity scale from "Abnormally Dry" (D0) to "Exceptional" (D4). Looking at this graph you can see the climate oscillates back and forth from very wet to very dry. There is no trend towards more droughts over the long haul like the climate change people would have you believe. But now with the change in solar activity there should be more floods.  TORNADOS Below is a graph showing the yearly number of tornados in the United States. It does not show a general increase over the decades.  The lying warmists changed their label from "global warming" to "climate change" and they win peoples minds by focusing on extreme weather events as if the world has ever been a tranquil place. We've always had natural disasters. Another group to watch out for are the christian "end of the world" promoters. "Repent for the end is near" is their main propaganda line. They want more clients. Just relax and breath deep. Focus on your heath and your economic stability and don't pay any attention to the extremists because they always have a hidden agenda. The recent change toward global cooling is expected to cause many extreme weather events. But the warmists will blame them on "global warming". It will be interesting to see if the government paid organizations will become even more corrupt and deceitful and present false data showing a continued warming trend. I am interested in hearing from any of you concerning temperature trends where you live. Below I once again show the Paraguay temperature record which shows warming up to 2006 and then a leveling off, and then rising for a few years and then cooling in 2016. This temperature record has not been "paid for" by 1st world governments. Periodic Global Warming is something that happens naturally, without man-made pollution, periodically. Please look at this temperature chart going back 450,000 years which shows the Earth has been hotter than now many times before. The 0 year is the present. It's about time we dropped back down to the normal "ice age" temperatures. 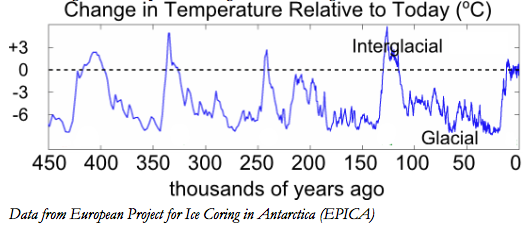 Global Warming has not had a steady rise in accord with the steady rise of CO2 and other man-made greenhouse gases. The Industrial Revolution started before 1870 with a near steady increase in gases but the true charts show global cooling from 1930 to 1970. If man-made gases were to blame then the rise would of been happening ever since the industrial revolution. Read why Earth's climate is self-regulating & independent of man-made CO2 (Click here) New paper finds increased CO2 or methane will have 'essentially no effect' upon global temperature or climate. (Click here) 400 parts per milliion of CO2 is made to sound real scary. But divide 400 by 1,000,000 and you'll see that the percentage of CO2 is only .04% which is 4% divided by a hundred. That is only one part of 2500 parts of air. I find it hard to believe that such a small amount can make a difference. They point to the planet Venus as an example of how CO2 causes global warming but the % of CO2 there is 96.5 which is 2412 times more than the .04% of 400PPM. So it is not a good example. They have no proof that such a small amount of CO2 causes global warming. Scientists admit that in the far distant past, as recorded in ice, the levels of CO2 always lagged at least 200 years behind the spikes in global temperatures. This contrasts what the warmists claim that high CO2 preceeds rise in global temperatures. (Click Here) Click here for the best video showing how this upward warming trend follows a very old pattern that is natural and has nothing to do with CO2. Click here for another great video explaining the global temperature cycles and how global cooling will be undeniable by 2019. The most successful weather predictor in the UK, Piers Corbyn, says that preceeding from 2017 we'll be getting colder and colder. He bases all his predictions on solar activity. (see video) |